Step 1 - Put Raw Spot Yield Data into DataFrame
Dataset
Spot yield data has been taken from the Bank of England website
| Term | ... | Term | |||||||||
|---|---|---|---|---|---|---|---|---|---|---|---|
| Date | 0.5 | 1 | 1.5 | 2 | 38 | 38.5 | 39 | 39.5 | 40 | ||
| 1970-01-31 | NaN | 8.64 | 8.71 | 8.7 | ... | NaN | NaN | NaN | NaN | NaN | |
| 1970-02-28 | NaN | 8.41 | 8.4 | 8.37 | ... | NaN | NaN | NaN | NaN | NaN | |
| 1970-03-31 | NaN | 7.74 | 7.78 | 7.8 | ... | NaN | NaN | NaN | NaN | NaN | |
| 1970-04-30 | NaN | 7.61 | 7.86 | 7.97 | ... | NaN | NaN | NaN | NaN | NaN | |
| 1970-05-31 | NaN | 7.39 | 7.74 | 7.86 | ... | NaN | NaN | NaN | NaN | NaN | |
| ... | ... | ... | ... | ... | ... | ... | ... | ... | ... | ... | |
| 2024-08-30 | 4.29 | 4.22 | 4.06 | 3.96 | ... | 4.42 | 4.41 | 4.4 | 4.38 | 4.37 | |
| 2024-09-30 | 4.38 | 4.16 | 3.96 | 3.85 | ... | 4.49 | 4.48 | 4.46 | 4.45 | 4.43 | |
| 2024-10-31 | 4.52 | 4.39 | 4.29 | 4.24 | ... | 4.7 | 4.69 | 4.67 | 4.66 | 4.64 | |
| 2024-11-29 | 4.4 | 4.22 | 4.12 | 4.07 | ... | 4.61 | 4.6 | 4.58 | 4.56 | 4.55 | |
| 2024-12-31 | 4.46 | 4.31 | 4.23 | 4.2 | ... | 4.97 | 4.95 | 4.93 | 4.92 | 4.9 | |
Python

Functions
load data files from BoE s/s function
load spreadsheet into dataframe function
# imports
import pandas as pd
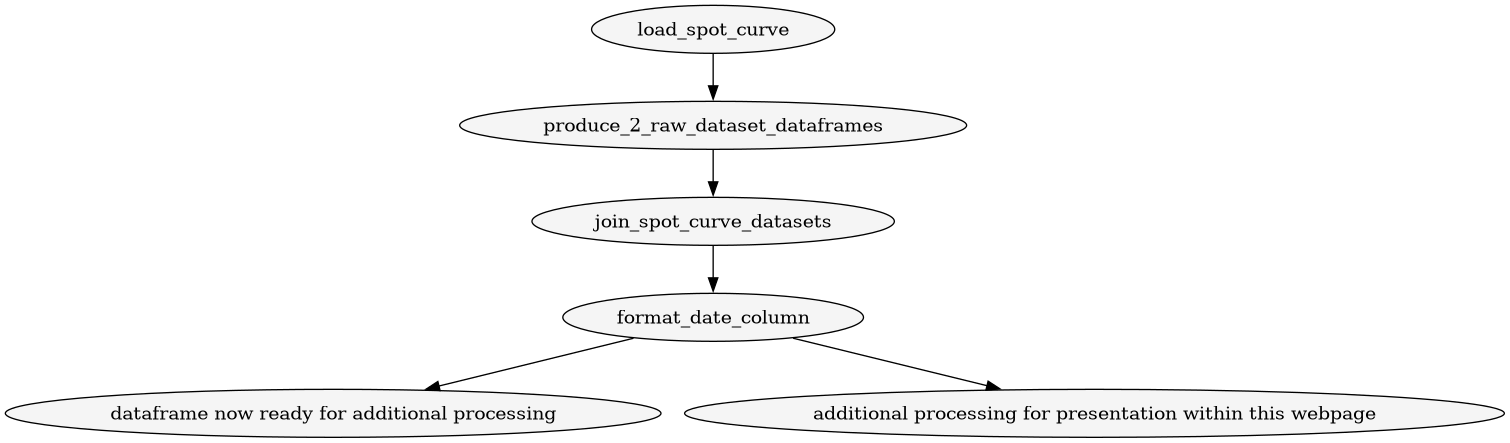
def load_spot_curve(file_path, sheet="4. spot curve", skiprows_data=5, skiprows_header=3):
"""
Loads an Excel spot curve sheet and returns a cleaned DataFrame with proper headers.
"""
# Load the raw data
df = pd.read_excel(file_path, sheet_name=sheet, engine="openpyxl", skiprows=skiprows_data, header=None)
# Load headers
col_names = pd.read_excel(file_path, sheet_name=sheet, engine="openpyxl", skiprows=skiprows_header, nrows=1, header=None)
col_names[0] = "Date"
df.columns = col_names.iloc[0]
return df
call load spreadsheet into dataframe twice function
from dataframes.load_individual_data_files import *
import pandas as pd

def produce_2_raw_dataset_dataframes(file_path1,file_path2):
    df1 = load_spot_curve(file_path1)
    df2 = load_spot_curve(file_path2)
    return df1, df2  # returning two DataFrames
join data files into 1 combined dataset function
import pandas as pd

def join_spot_curve_datasets(df1,df2):
    #join the two dataframes to create df
    df = pd.concat([df1, df2], ignore_index=True)
    return df
format the dataframe
format date column fucntion
import pandas as pd

def format_date_column(df, column_name='Date'):
    """
    Converts a datetime column to a string in 'YYYY-MM-DD' format.

    Args:
        df (pd.DataFrame): The DataFrame containing the column.
        column_name (str): Name of the column to format. Default is 'Date'.

    Returns:
        pd.DataFrame: DataFrame with the formatted date column.
    """
    df[column_name] = df[column_name].dt.strftime('%Y-%m-%d')
    return df
perform rounding
import pandas as pd

def round_numeric_columns(df, decimals=2):
    numeric_cols = df.select_dtypes(include='number').columns
    df[numeric_cols] = df[numeric_cols].round(decimals)
    return df
truncate with ellipsis function
import pandas as pd

def truncate_with_ellipsis(df, n=5):
    """
    Keep first n and last n rows/cols, insert ellipsis in between.
    """

    # ---- columns ----
    if df.shape[1] > 2 * n:
        cols = list(df.columns[:n]) + ["..."] + list(df.columns[-n:])
        df_cols = df[cols[:n] + cols[-n:]].copy()
        df_cols.insert(n, "...", "...")  # middle column
    else:
        df_cols = df.copy()

    # ---- rows ----
    if df_cols.shape[0] > 2 * n:
        top = df_cols.iloc[:n]
        bottom = df_cols.iloc[-n:]

        ellipsis_row = pd.DataFrame(
            [["..."] * df_cols.shape[1]],
            columns=df_cols.columns,
            index=["..."]
        )

        result = pd.concat([top, ellipsis_row, bottom])
    else:
        result = df_cols

    return result
Run the sequence of functions
datafram for addtional processing
from dataframes.truncate_with_ellipsis import *
from dataframes.produce_2_raw_dataset_dataframes import *
from dataframes.round_numeric_columns import *
from dataframes.format_date_column import *
from dataframes.join_data_files import *
import pandas as pd

def create_raw_dataset_for_presentation(file_path1="raw_data/GLC Nominal month end data_1970 to 2015.xlsx",file_path2="raw_data/GLC Nominal month end data_2016 to present.xlsx"):
    """Load a spot curve file and apply formatting."""
    df1, df2 = produce_2_raw_dataset_dataframes(file_path1,file_path2)
    df = join_spot_curve_datasets(df1,df2)
    df = format_date_column(df)
    df = round_numeric_columns(df, 2)
    df.columns = pd.MultiIndex.from_product([['Term'], df.columns])
    return truncate_with_ellipsis(df).to_html(index=False)
dataframe for this webpage
from dataframes.truncate_with_ellipsis import *
from dataframes.produce_2_raw_dataset_dataframes import *
from dataframes.round_numeric_columns import *
from dataframes.format_date_column import *
from dataframes.join_data_files import *
import pandas as pd

def create_raw_dataset_for_presentation(file_path1="raw_data/GLC Nominal month end data_1970 to 2015.xlsx",file_path2="raw_data/GLC Nominal month end data_2016 to present.xlsx"):
    """Load a spot curve file and apply formatting."""
    df1, df2 = produce_2_raw_dataset_dataframes(file_path1,file_path2)
    df = join_spot_curve_datasets(df1,df2)
    df = format_date_column(df)
    df = round_numeric_columns(df, 2)
    df.columns = pd.MultiIndex.from_product([['Term'], df.columns])
    return truncate_with_ellipsis(df).to_html(index=False)
Data
Here are download links to the spreadsheets obtained from the Bank of England website, referenced in the above function:
- dataset 1
- dataset 2
Using the functions defined above and plugging in the location of the datasets obtained from the Bank of England we get: